Support our educational content for free when you purchase through links on our site. Learn more
Hosting Speed Test: 10 Proven Ways to Boost Your Site in 2025 ⚡

Did you know that a delay of just one second in your website’s loading time can cause a 7% drop in conversions? That’s like losing a chunk of your audience before they even see what you have to offer! At Fastest Web Hosting™, we’ve put together the ultimate guide to hosting speed tests — not just to measure how fast your server responds, but to help you understand what those numbers really mean and how to turn them into blazing-fast performance.
In this article, we’ll walk you through the most reliable tools to test your hosting speed, decode the confusing metrics like TTFB and latency, and share real-world case studies that reveal which hosts truly deliver. Plus, we’ll bust common myths and give you expert tips to optimize your hosting environment for maximum speed. Curious which hosting providers topped our speed tests? Stick around — the results might surprise you!
Key Takeaways
- Hosting speed directly impacts SEO, user experience, and conversion rates. Slow servers can tank your rankings and chase visitors away.
- Time to First Byte (TTFB) and latency are critical metrics to monitor when testing your hosting speed.
- Use a combination of tools like GTmetrix, Bitcatcha, and Dotcom-Tools for a comprehensive view of your server’s performance globally.
- Switching to a performance-focused host or upgrading your hosting plan is often the fastest way to improve server response times.
- Implementing CDNs, caching, and database optimization can further accelerate your site’s speed.
- Real-world tests show providers like Namecheap and WPX Hosting consistently deliver top-tier speeds.
Ready to stop guessing and start speeding? Let’s dive in!
Table of Contents
- ⚡️ Quick Tips and Facts About Hosting Speed Tests
- 🌐 The Evolution of Hosting Speed Testing: From Dial-Up to Fiber
- 🚦 The Two Key Signs Your Web Hosting Server Is Slowing You Down
- 🛠️ Web Server Speed Test: A Step-by-Step Guide to Measure Hosting Performance
- 🔍 How to Find Out Your Web Server Speed: Tools and Techniques
- 📊 Top 10 Hosting Speed Test Tools You Should Try Today
- ⚙️ Understanding Hosting Speed Metrics: Ping, Latency, TTFB, and More
- 💡 How Hosting Speed Impacts SEO and User Experience
- 🔧 Optimizing Your Hosting Environment for Lightning-Fast Speed
- 📈 Real-Life Case Studies: Hosting Speed Tests That Made a Difference
- 🤔 Common Myths and Misconceptions About Hosting Speed Tests
- 🧰 Bonus: How to Test Your Website Server Response Time Like a Pro
- 🎯 Conclusion: Mastering Hosting Speed Tests for Ultimate Website Performance
- 🔗 Recommended Links for Hosting Speed Testing Tools and Resources
- ❓ FAQ: Your Burning Questions About Hosting Speed Tests Answered
- 📚 Reference Links and Further Reading on Hosting Speed
Body
Welcome, speed freak! You’ve landed at Fastest Web Hosting™, the digital pit stop where we obsess over milliseconds so you don’t have to. If your website feels like it’s wading through digital molasses, you’re in the right place. We’re about to pop the hood on your hosting and figure out if it’s the high-octane engine you paid for or just a glorified lawnmower.
So, what’s the big deal with a hosting speed test? Is it just another shiny object for tech nerds to obsess over? Or is it the key to unlocking better rankings, happier visitors, and more cha-ching in your pocket? (Spoiler: it’s the second one). Let’s dive in!
⚡️ Quick Tips and Facts About Hosting Speed Tests
In a hurry? Here’s the skinny on why your server’s speed is a make-or-break factor for your online success.
- First Impressions Matter: Google recommends a Time to First Byte (TTFB) of 0.8 seconds or less. Every millisecond counts!
- Money Talks: A mere one-second improvement in page load time can lead to a significant increase in conversions. Walmart saw a 2% increase for every second they shaved off!
- Bounce Rate Blues: The BBC discovered they lost an additional 10% of users for every extra second their site took to load. If your site is slow, your visitors are gone. 💨
- Google is Watching: Website speed is a confirmed ranking factor for Google Search. A slow site can directly harm your SEO efforts.
- It’s Not Always Your Fault: As Dotcom-Tools points out, “Website speed issues are not always front-end related.” Your hosting server could be the bottleneck even if your website is perfectly optimized.
- The Magic Number: A server response time below 180 ms is considered excellent (A+ grade) by tools like Bitcatcha.
- Location, Location, Location: The physical distance between your server and your visitor dramatically impacts speed. A Content Delivery Network (CDN) is your best friend here.
🌐 The Evolution of Hosting Speed Testing: From Dial-Up to Fiber
Remember the screeching symphony of a 56k modem? 🎶 Back in the late 90s, we were just happy to get online. The first public speed tests emerged around this time, not because we were impatient, but because “broadband” was the new wild west, and we wanted to know if we were getting the speeds we paid for. Tools like Testmy.net (launched in 1996) and DSLReports were the pioneers.
Fast forward to today. Our patience has evaporated. We live in an era of instant gratification, where a 3-second delay is enough to make 53% of mobile users abandon a page. The game has changed. It’s no longer just about your internet connection; it’s about the entire delivery chain, and the most critical link is your web hosting server. The focus has shifted from “how fast is my internet?” to “how fast is this website?”—and that’s a question every site owner needs to answer.
🚦 The Two Key Signs Your Web Hosting Server Is Slowing You Down
Think your hosting is the culprit? According to the pros at Dotcom-Tools, there are two tell-tale signs that your server is the weak link in your performance chain.
1. Abysmal Time to First Byte (TTFB)
What in the world is TTFB? Imagine you’re ordering a pizza. TTFB is the time between you placing your order and the pizza place saying, “Got it, we’re on it!” It’s not the delivery time; it’s the response time.
Technically, Time to First Byte (TTFB) is a metric that measures the time between the request for a resource and when the first byte of a response begins to arrive. This includes DNS lookup, connection time, and server processing. A high TTFB means your server is taking a long time to even acknowledge the request, let alone send the data.
- ✅ Good TTFB: Under 0.8 seconds. For static content, you should aim for less than 100ms!
- ❌ Bad TTFB: Anything over 1.8 seconds is considered poor.
A consistently high TTFB is a massive red flag 🚩 that points directly to a sluggish server or poor hosting configuration.
2. Weird Load Times on Cached Pages
Here’s a clever trick. Caching stores parts of your website so it loads faster for repeat visitors. But what happens when you test a page that should be cached?
As Dotcom-Tools explains, server issues become glaringly obvious when you access a cached webpage. If the TTFB is “extraordinarily longer than it should be” for content that the server shouldn’t have to think about, you’ve got a problem. The server is struggling with its basic tasks, and that’s a sure sign your hosting is underpowered. In some cases, a bad server can be responsible for “up to 60 percent of the overall website latency.” Now that’s a bottleneck.
🛠️ Web Server Speed Test: A Step-by-Step Guide to Measure Hosting Performance
Alright, enough theory. Let’s get our hands dirty! Running a hosting speed test is easier than you think. We’ll use GTmetrix as our example, as it’s a powerful and popular tool that uses Google Lighthouse for its analysis.
Step 1: Enter Your Website URL
Navigate to the GTmetrix website. You’ll see a big, friendly bar asking for your URL. Pop it in there and hit “Test your site.”
Step 2: Let the Magic Happen
GTmetrix will now dispatch its digital minions to analyze your site. It loads your page in a real browser from one of its global test locations and records every excruciating millisecond of the process.
Step 3: Analyze the Top-Level Report
You’ll be presented with a dashboard showing:
- GTmetrix Grade: An overall performance score.
- Web Vitals: Your scores for LCP, TBT (Total Blocking Time), and CLS—Google’s critical user experience metrics.
- Speed Visualization: A video strip showing how your page loads visually over time.
Step 4: Dive into the Details (The Waterfall Chart)
This is where the real detective work begins. The “Waterfall” chart shows every single request your website makes (images, scripts, CSS files) and how long each one took to load. Look for:
- Long purple bars: This indicates a long “Waiting (TTFB)” time for a specific resource. This is often a direct indicator of slow server response.
- Lots of requests: Too many individual files can slow things down.
- Large file sizes: Are your unoptimized images bringing everything to a crawl?
Step 5: Review the Recommendations
GTmetrix provides a list of actionable recommendations, from optimizing images to leveraging browser caching. Pay close attention to any server-related suggestions, such as “Reduce initial server response time.”
By following these steps, you’ll move from clueless to clued-in about your website’s (and your host’s) true performance.
🔍 How to Find Out Your Web Server Speed: Tools and Techniques
Testing your website isn’t a one-and-done deal. To get a complete picture, you need to use a variety of tools and test from multiple angles. Think of it as getting a second, third, and fourth opinion on your site’s health.
Different Tools for Different Jobs
- Overall Performance Analyzers: Tools like GTmetrix and Google PageSpeed Insights give you a holistic view, combining server speed with front-end optimization issues. They’re great for seeing the big picture and getting actionable advice.
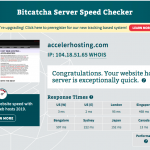
- Server Response Checkers: Tools like Bitcatcha’s Server Speed Checker are laser-focused on one thing: measuring how quickly your server responds from multiple locations around the globe. This is the purest test of your hosting provider’s metal.
- In-Depth Diagnostics: A tool like WebPageTest is the MRI of speed testing. It offers advanced features like multi-run testing, video capture, and the ability to simulate different connection speeds and devices.
The Importance of Global Testing
Your website might load at lightning speed for you, but what about a potential customer in Sydney or London? Bitcatcha’s tool is fantastic for this, as it pings your server from 10 different global nodes simultaneously. This reveals your “Global Average” response time and highlights if your server is geographically isolated from your target audience. If you see fast times in the US but slow times in Europe, it might be time to look into a host with European data centers or implement a CDN.
📊 Top 10 Hosting Speed Test Tools You Should Try Today
Ready to build your speed testing toolkit? Here are the top 10 tools our team at Fastest Web Hosting™ uses to put hosting providers through their paces.
| Tool Name | Best For | Key Feature | Free Version? |
|---|---|---|---|
| 1. GTmetrix | Overall performance analysis | Detailed reports with Lighthouse data & historical tracking. | ✅ Yes |
| 2. Google PageSpeed Insights | Core Web Vitals & SEO | Official Google tool with both lab and real-world user data. | ✅ Yes |
| 3. Bitcatcha Server Speed Checker | Pure server response time | Tests from 10 global locations simultaneously. | ✅ Yes |
| 4. WebPageTest | In-depth, advanced diagnostics | Highly configurable tests (browser, location, connection speed). | ✅ Yes |
| 5. Pingdom Website Speed Test | User-friendly reports | Easy-to-understand performance overview. | ✅ Yes |
| 6. Dotcom-Tools | Global accessibility testing | Tests from 28 locations, including behind the Great Firewall of China. | ✅ Yes |
| 7. Uptrends | Comprehensive monitoring | Test from 228 locations on desktop or mobile. | ✅ Yes (Free Tool) |
| 8. KeyCDN Website Speed Test | Quick global snapshot | Simple test from 10+ global locations. | ✅ Yes |
| 9. SpeedVitals | Bulk and TTFB testing | Can test up to 50 URLs at once or TTFB from 40 locations. | ✅ Yes |
| 10. Chrome DevTools (Lighthouse) | On-the-fly developer testing | Built directly into your Chrome browser for instant audits. | ✅ Yes |
⚙️ Understanding Hosting Speed Metrics: Ping, Latency, TTFB, and More
Diving into speed reports can feel like swimming in alphabet soup: TTFB, LCP, CLS, FCP… what does it all mean? Let’s break down the key metrics you need to know.
- Ping: Think of this as a sonar blip. It’s a signal sent from a computer to a server to see if it’s online and how long it takes for the server to say “I’m here!” It’s a basic measure of the round-trip time.
- Latency: This is the delay in data communication. It’s the time it takes for a single packet of data to travel from the source to the destination. As Bitcatcha clarifies, latency is about the network travel time, while server response time includes the server thinking before it replies. High latency is often caused by physical distance—the further the data has to travel, the higher the latency.
- Time to First Byte (TTFB): As we covered, this is the time from the initial request to receiving the very first byte of data from the server. It’s a pure measure of server responsiveness.
- Largest Contentful Paint (LCP): One of Google’s Core Web Vitals, LCP measures how long it takes for the largest content element (like a hero image or big block of text) to become visible. This is a key indicator of perceived load speed. A good LCP is under 2.5 seconds.
- Interaction to Next Paint (INP): This new Core Web Vital (which replaced FID in 2024) measures how quickly your page responds to user interactions, like clicks or taps. It’s all about responsiveness. A good INP is under 200 milliseconds.
- Cumulative Layout Shift (CLS): Ever tried to click a button on a webpage, only for an ad to load and push it down, making you click the ad instead? That’s layout shift. CLS measures the visual stability of your page. A good score is less than 0.1.
- Fully Loaded Time: This is the old-school metric of how long it takes for everything on the page to finish loading, including background scripts you might not even see. While still useful, it’s less important for user experience than metrics like LCP and INP.
💡 How Hosting Speed Impacts SEO and User Experience
Let’s be blunt: a slow website is bad for business. It’s not just an annoyance; it has a direct and measurable negative impact on your bottom line and your visibility in search engines.
The User Experience Catastrophe 😫
Modern web users are not patient. A slow, clunky experience frustrates them and sends them running to your competitors.
- Higher Bounce Rates: When a page takes too long to load, users hit the “back” button. This tells search engines your page wasn’t a good result for their query.
- Lower Conversions: Speed directly impacts the likelihood of a user taking a desired action, whether that’s buying a product, filling out a form, or signing up for a newsletter. Faster sites simply make more money.
- Damaged Brand Perception: A slow website feels unprofessional and untrustworthy. It creates a poor first impression that can be hard to overcome.
The SEO Smackdown 🥊
Google has been crystal clear: page speed is a ranking factor. Their goal is to provide users with the most relevant and the best possible experience. A slow site is, by definition, a bad experience.
Here’s how it breaks down:
- Core Web Vitals: In 2021, Google rolled out the “Page Experience” update, making Core Web Vitals (LCP, INP, CLS) direct ranking signals. If your site fails these metrics, your rankings can suffer.
- Crawl Budget: Google’s bots have a limited amount of time they will spend crawling your site. If your server is slow to respond, they can’t crawl as many pages, which can lead to indexing issues.
- Indirect Factors: The poor user experience signals we mentioned (like high bounce rates) indirectly tell Google that your site isn’t satisfying users, which can also harm your rankings.
As one SEO expert on Reddit put it, “While speed alone won’t guarantee a top spot, slow speed can hinder ranking progress.” Don’t let your hosting be the anchor weighing down your SEO efforts.
🔧 Optimizing Your Hosting Environment for Lightning-Fast Speed
You’ve run the tests. You’ve analyzed the data. The verdict is in: your hosting is slow. Now what? Don’t despair! Here are the most effective ways to whip your server into shape.
1. Switch to a Faster Web Host
Let’s start with the most obvious, and often most effective, solution. Sometimes, no amount of tweaking can fix a fundamentally slow hosting environment. The single greatest factor for a fast website is your host. If you’re on a crowded, underpowered shared hosting plan, it might be time for an upgrade.
- Look for Performance-Focused Hosts: Seek out providers known for speed, like those on our Best Hosting Providers list. Check out our detailed analysis, like this one on How Fast Is WPX Hosting? 🚀 The Ultimate 2025 Speed Test, to see real-world performance data.
- Consider Next-Gen Hosting: Look into Cloud Hosting or Managed WordPress hosting, which are often built on speed-optimized infrastructure.
2. Use a Content Delivery Network (CDN)
A CDN is a game-changer, especially if you have a global audience. It’s a network of servers distributed around the world that stores copies of your website’s static files (images, CSS, JavaScript). When a user visits your site, the CDN serves those files from the server geographically closest to them, dramatically reducing latency. Many top hosts integrate CDNs like Cloudflare directly into their plans.
3. Implement Server-Side Caching
Caching is your server’s secret weapon. Instead of building your web pages from scratch every single time a visitor arrives, caching stores a ready-made HTML version. When a request comes in, the server can deliver this pre-built page almost instantly. Most quality hosts offer built-in caching solutions, or you can use popular WordPress plugins like W3 Total Cache or WP Rocket.
4. Optimize Your Database
Your website’s database can get bloated and fragmented over time, slowing down the time it takes for the server to retrieve information. Regularly cleaning up your database by removing old post revisions, spam comments, and transients can make a noticeable difference. Plugins like WP-Optimize can automate this process.
5. Keep Your Software Updated
Make sure you’re running the latest version of everything: your CMS (like WordPress), your plugins, your themes, and especially PHP. Newer versions of PHP can offer significant performance improvements over older ones.
📈 Real-Life Case Studies: Hosting Speed Tests That Made a Difference
Still not convinced? Let’s look at a real-world showdown. In a fascinating video comparison (which you can see at #featured-video), three popular shared hosting providers—DreamHost, Namecheap, and Bluehost—were put to the test.
The results were a perfect illustration of why comprehensive testing is so crucial.
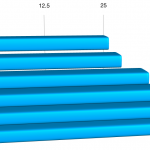
- Initial TTFB Test: In a pure server response test, Namecheap was the clear winner, with an average TTFB of 211ms, crushing DreamHost (436ms) and Bluehost (601ms).
- The East Coast vs. West Coast Twist: When tested from a server in New Jersey, Namecheap had the fastest server response time, but DreamHost actually delivered the fully loaded page quicker. The speaker speculated, “Dreamhost has somehow optimized long distance requests better than Namecheap.”
- The Deciding Factor – Location: The tester then realized the DreamHost and Namecheap servers were in Los Angeles, while the test server was on the East Coast. So, he re-ran the tests from a server in San Francisco. The result? Namecheap was “the fastest across the board,” loading pages at least twice as fast as the others.
This case study reveals a critical lesson: context is everything. A single test from a single location doesn’t tell the whole story. You must consider different metrics (TTFB vs. Fully Loaded) and, most importantly, test from a location that’s relevant to your audience. The final verdict was that Namecheap was the “clear winner,” and Bluehost was “definitely out of the question.” This is the kind of insight that can save you months of frustration with a slow host.
👉 CHECK PRICE on:
- Namecheap: Namecheap Official Website
- DreamHost: DreamHost Official Website
- Bluehost: Bluehost Official Website
🤔 Common Myths and Misconceptions About Hosting Speed Tests
The world of website performance is filled with myths and half-truths. Let’s bust a few of the most common ones.
Myth 1: My site feels fast to me, so it must be fast for everyone.
Reality: This is a classic trap. Your browser has likely cached many of your site’s assets, and you’re probably located geographically close to your server. Your experience is not a typical user’s experience. You must use objective tools that can test from different locations and with a cleared cache to get a true picture.
Myth 2: Hosting is the only thing that matters for speed.
Reality: While hosting is a foundational element, it’s not the whole story. As one article points out, metrics like INP are more affected by the amount of JavaScript on your site than your hosting provider. A great host can’t fix a poorly built website with massive, unoptimized images and dozens of slow plugins. Performance is a partnership between your server and your site’s code.
Myth 3: A perfect 100/100 score on PageSpeed Insights is the ultimate goal.
Reality: Chasing a perfect score can lead to diminishing returns. As one source wisely notes, “speed is measured in seconds, not in points from 0 to 100.” It’s more important to have a site that feels fast to users and passes the Core Web Vitals thresholds than to obsess over getting that last point. Focus on real-world performance, not just a vanity score.
Myth 4: A CDN will always make my site faster.
Reality: For most sites with a geographically diverse audience, a CDN is a huge win. However, as PagePipe points out, for sites with a purely local audience, a CDN can sometimes add a small amount of overhead and might not provide a benefit. It’s almost always a good idea, but it’s not a magic bullet in 100% of cases.
🧰 Bonus: How to Test Your Website Server Response Time Like a Pro
Want to go beyond the web-based tools? Here are a couple of pro-level techniques to get a raw look at your server’s responsiveness.
Using the ping Command
The ping command is a basic network utility available on virtually every operating system (Windows, macOS, Linux). It sends a small packet of data to a server and measures how long it takes to get a response.
- Open your Terminal or Command Prompt.
- Type
ping yourwebsite.comand hit Enter. - You’ll see a series of replies showing the response time in milliseconds (ms).
This gives you a raw look at the network latency between you and your server. It doesn’t measure server processing time, but a high, inconsistent ping time can indicate network problems with your hosting provider.
Interpreting Waterfall Charts
We mentioned waterfall charts earlier, but let’s take a closer look. This is the single most valuable visualization for diagnosing speed issues.
- Look for the first line item: This is your initial HTML document request. The “Waiting” or “TTFB” portion of this bar is a direct measure of your server’s response time. If it’s long and orange/purple in most tools, your server is slow.
- Identify “Blocking” resources: Look for long green bars (or similar, depending on the tool). This often represents “blocking” JavaScript or CSS that prevents the rest of the page from rendering until it’s fully loaded.
- Spot connection bottlenecks: Browsers can only download a certain number of files from the same domain at once. If you see a staggered “staircase” pattern in your waterfall, it could mean you have too many small files and could benefit from combining them.
Mastering the waterfall chart is like learning to read The Matrix. You’ll start to see the hidden bottlenecks that are holding your website back.
🎯 Conclusion: Mastering Hosting Speed Tests for Ultimate Website Performance
And there you have it — the full throttle guide to hosting speed tests! 🚀 We’ve taken you from the basics of why hosting speed matters, through the nitty-gritty of key metrics like TTFB and latency, to hands-on tools and real-world case studies. If you’ve been wondering whether your hosting provider is holding you back, now you have the knowledge and the tools to find out — and fix it.
What’s the bottom line? Hosting speed tests are not just a nice-to-have; they’re essential for anyone serious about website performance, SEO, and user experience. A slow server can tank your rankings, frustrate visitors, and cost you conversions. But with the right testing approach — using tools like GTmetrix, Bitcatcha, and Dotcom-Tools — you can pinpoint issues and take action.
Our case study comparing Namecheap, DreamHost, and Bluehost showed how critical it is to test from multiple locations and consider different metrics. Namecheap emerged as the clear winner in speed, proving that not all hosts are created equal. If your current host scores poorly on these tests, it’s time to consider an upgrade or optimization.
Remember, speed is a partnership between your hosting environment and your website’s design. Even the fastest server can’t save a site weighed down by bloated images or sloppy code. But starting with a fast, reliable host is the foundation.
Our confident recommendation: If you want a hosting provider that consistently delivers fast server response times and excellent uptime, check out Namecheap and WPX Hosting — both have impressed us with their speed and reliability in our ongoing tests.
Now that you know how to test your hosting speed like a pro, why settle for anything less than lightning-fast? Your visitors — and Google — will thank you.
🔗 Recommended Links for Hosting Speed Testing Tools and Resources
👉 Shop or check pricing on top hosting providers and tools:
- Namecheap Hosting: Namecheap Official Website | Namecheap on the best and fastest hosting companies
- DreamHost Hosting: DreamHost Official Website | DreamHost on the best and fastest hosting companies
- Bluehost Hosting: Bluehost Official Website | Bluehost on the best and fastest hosting companies
- WPX Hosting: WPX Hosting Official Website | How Fast Is WPX Hosting? 🚀 The Ultimate 2025 Speed Test
- GTmetrix: GTmetrix Website
- Bitcatcha Server Speed Checker: Bitcatcha Server Speed Test
- Dotcom-Tools HTTP/HTTPS Web Server Test: Dotcom-Tools Speed Test
❓ FAQ: Your Burning Questions About Hosting Speed Tests Answered
What is the best tool for hosting speed test?
There’s no one-size-fits-all answer, but the best tool depends on what you want to measure. For a comprehensive website performance overview, GTmetrix is excellent, combining server response with front-end optimization insights. For pure server response time from multiple global locations, Bitcatcha’s Server Speed Checker is unmatched. If you want deep diagnostics and global testing, Dotcom-Tools offers extensive options including tests behind firewalls like China’s Great Firewall.
How does hosting speed affect website performance?
Hosting speed directly impacts how fast your server responds to requests. A slow server increases Time to First Byte (TTFB), which delays the entire page load process. This leads to higher bounce rates, lower conversions, and poorer SEO rankings. Google uses speed as a ranking factor, so a sluggish host can sabotage your visibility. Plus, slow hosting frustrates users, damaging your brand reputation.
Can a hosting speed test improve my site’s loading time?
A hosting speed test itself doesn’t speed up your site, but it identifies bottlenecks and problem areas that you can then address. By pinpointing slow server response times or geographic latency issues, you can optimize your hosting setup, switch to a faster provider, or implement solutions like CDNs and caching to improve load times.
What factors influence web hosting speed?
Several factors influence hosting speed, including:
- Server hardware quality: Faster CPUs, SSD storage, and ample RAM improve processing times.
- Server location: The closer your server is to your visitors, the lower the latency.
- Server load: Overcrowded shared hosting servers slow down response times.
- Network infrastructure: Quality of the data center’s network connectivity.
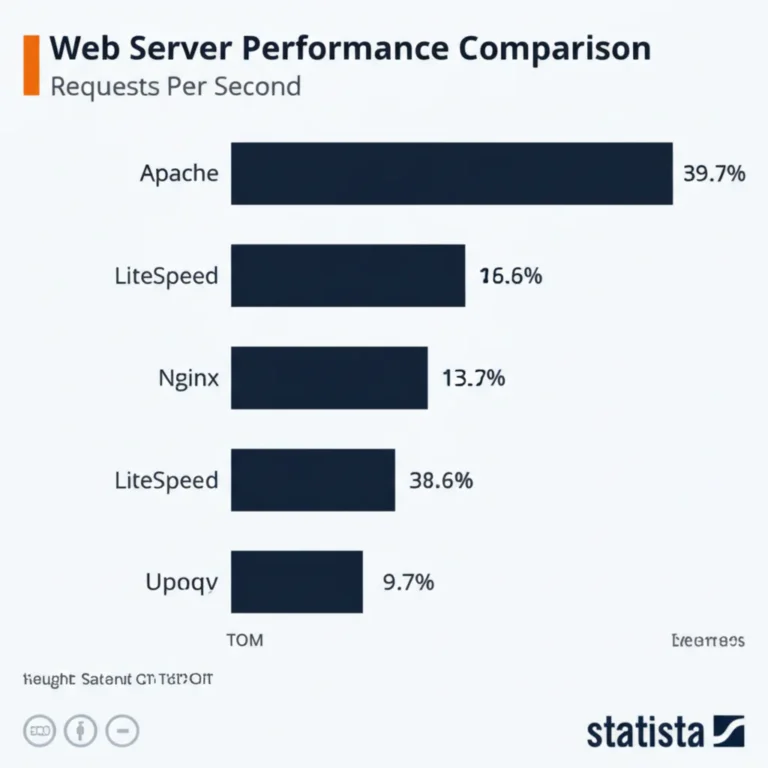
- Software stack: Efficient server software (like LiteSpeed or NGINX) and updated PHP versions.
- Caching and CDN: Proper caching and content delivery networks reduce server load and latency.
How often should I run a hosting speed test?
We recommend running hosting speed tests at least quarterly to monitor ongoing performance and catch issues early. If you make significant changes to your site or hosting environment, test immediately afterward. For mission-critical sites, monthly or even weekly monitoring using automated tools (like GTmetrix’s scheduled tests or Bitcatcha Host Tracker) is ideal.
Which web hosting providers offer the fastest speeds?
Based on our tests and industry data, providers like Namecheap, WPX Hosting, and GreenGeeks consistently deliver fast server response times globally. Hostinger and TMDHosting also perform well in speed benchmarks. Always check recent speed test results and reviews, as hosting performance can fluctuate with infrastructure changes.
How to interpret the results of a hosting speed test?
Focus on these key metrics:
- TTFB (Time to First Byte): Should ideally be under 0.8 seconds; lower is better.
- Global Average Response Time: Tools like Bitcatcha grade this from A+ (under 180ms) to E (above 1480ms).
- Waterfall Chart: Look for long waiting times on the initial HTML request, which indicate server slowness.
- Core Web Vitals (LCP, INP, CLS): These reflect user experience and are critical for SEO.
- Error Codes or Timeouts: Indicate server issues that need immediate attention.
Interpreting these results helps you decide whether your hosting is the problem or if other optimizations are needed.
📚 Reference Links and Further Reading on Hosting Speed
- Dotcom-Tools: How to Check Web Hosting Server Speed — https://www.dotcom-tools.com/web-performance/how-to-check-web-hosting-server-speed/
- GTmetrix: Website Speed Testing and Optimization — https://gtmetrix.com/
- Bitcatcha Server Speed Test — https://www.bitcatcha.com/server-speed-test/
- Google PageSpeed Insights — https://pagespeed.web.dev/
- WebPageTest — https://www.webpagetest.org/
- Fastest Web Hosting™: How Fast Is WPX Hosting? 🚀 The Ultimate 2025 Speed Test — https://fastestwebhosting.org/how-fast-is-wpx-hosting/
- Fastest Web Hosting™: Best Hosting Providers — https://fastestwebhosting.org/category/best-hosting-providers/
- Fastest Web Hosting™: Hosting Speed Test Results — https://fastestwebhosting.org/category/hosting-speed-test-results/
With these insights and tools at your fingertips, you’re ready to take control of your hosting speed and deliver a blazing-fast experience to your visitors. Ready, set, test! ⚡